The speculation is finally over. Ahead of the Pittsburgh Steelers Week 10 game, they have traded for former Jets WR Mike Williams, using one of their pair of fifth-round picks to do so.
Today, I wanted to look at and focus on 2024 receiving data on Williams, including league-wide and current Steelers. A full rankings table is included at the end of the article for context. The goal is to compare how things have gone so far this season and what Williams could provide the Black and Gold.
Let’s start with routes run and targets for receivers’ quantity of opportunities:
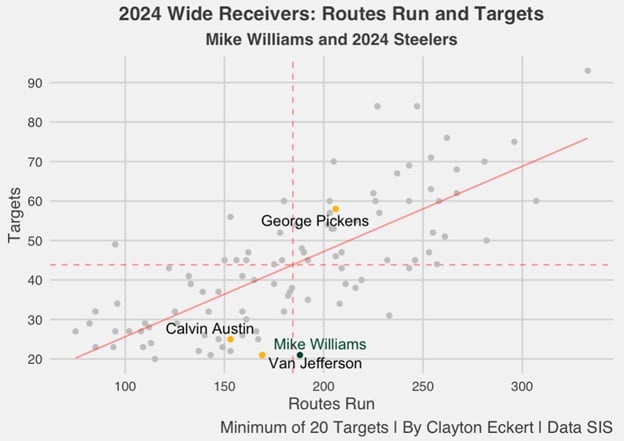
Mike Williams lands slightly above the mean in routes run with 188, ranking 47th out of the 100 qualifying WRs (min. of 20 targets). We see targets were much harder to come by in a talented WR room in New York, with only 21 (T-97th). I would expect that ratio to grow substantially in Pittsburgh, with less depth that spurred the acquisition.
Landing closest to Van Jefferson on the visual sheds light on his 2024 opportunities to date, and it will be fascinating to see how Williams’ presence impacts the rest of the room and Pittsburgh’s offense.
Now examining targets further: adding yardage context with average distance of target (ADoT) along with average distance of catch (ADoC):
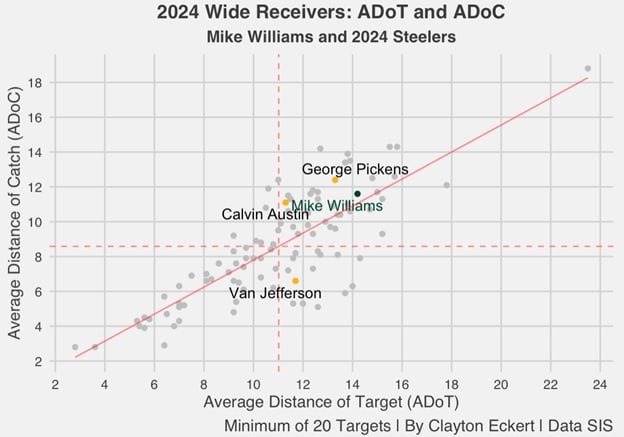

The visual highlights Mike Williams’ reputation as a deep ball threat. This pairs well with QB Russell Wilson’s moonball abilities and adds a layer to the passing game next to one of the best in the NFL already, WR George Pickens.
For more context, Williams has a 14.2 ADoT that leads all highlighted players and ranks 12th league-wide, with an 11.6 ADoC that ties for 20th. Pickens’ 13.3 ADoT (T-23rd), with a better 12.4 ADoC that ties for tenth most in the NFL. I, for one, wouldn’t look forward to that challenge if I were a coach.
WR Calvin Austin also lands above the mean in each, particularly the more important ADoC (23rd), compared to an 11.3 ADoT (52nd). Where Pittsburgh lacked deep connection most was Van Jefferson, with an above-average 11.7 ADoT (T-43rd), but plummeting in comparison to a low 6.6 ADoC (T-71st).
So, this will likely be one of the biggest changes and impacts Williams will provide immediately, encouragingly.
Here are NFL receivers on target catch rates (total receptions divided by the number of catchable targets) and drop percentages (drops divided by catchable targets):
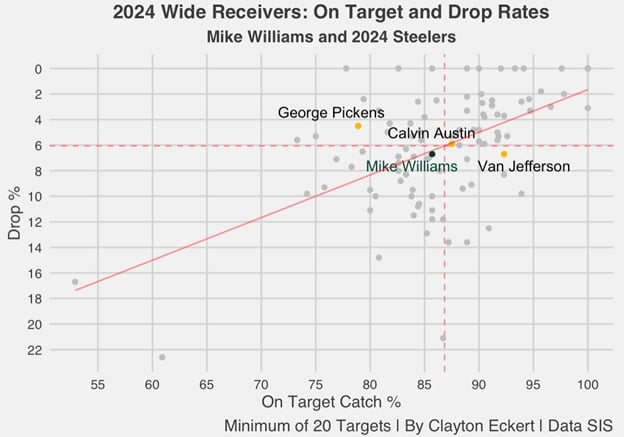

While it could be worse, Mike Williams has been slightly below average in the hands department this season. His 85.7 on-target catch rate ties for 55th, and he has a 6.7 drop rate that ties for 61st. Ironically, the latter ties with Jefferson, with Williams’ number more bearable considering his ADoT.
Williams does have a better on-target catch rate than Pickens (78.9), which ranks a lowly 91st of 100. The caveat for Williams is only one drop, with his low target total dinging his drop rate. Something we might see crop up, but knock on wood, is not a huge issue.
Next, I wanted to look at and provide overall completion percentages, along with receiver ratings (quarterback passer rating when targeted):
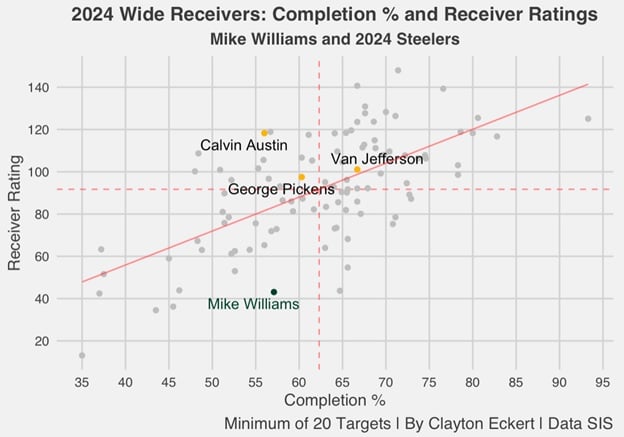

This highlights the dismay that the 3-6 New York Jets have suffered overall in 2024. The team hasn’t been playing well overall, including QB Aaron Rodgers’ far cry from his play that will likely make him a future Hall of Famer, including a 37-15 recent loss to Pittsburgh.
Mike Williams caught just 12 passes on his 21 targets this season for a poor 57.1 completion rate (70th). Within poor results here for Williams are two interceptions on his targets, along with no TDs, which severely dings his abysmal 43.1 receiver rating that is fifth worst among qualifiers (96th).
As the visual illustrates, all three Pittsburgh receivers have above-average receiver ratings. That is impressive on their part but also indicative of quarterback play, which has been far better overall in Pittsburgh this season. Hopefully, this aids a much better second half of 2024 for Williams.
Other important elements I wanted to look at come situationally, so here are receivers’ first down rates, along with broken/missed tackles per reception to see who earned/created extra yardage:
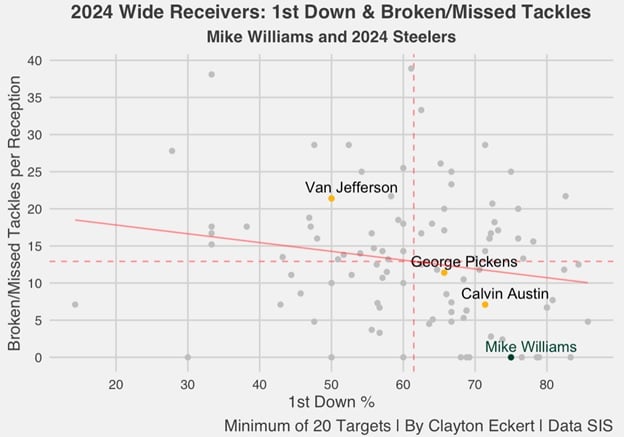

Extreme sides of the spectrum for Mike Williams. The great news is he’s been a chain mover, with a 75.0-percent first down rate that ties for 16th. This is low volume and makes sense with his ADoC. Knock on wood, that impact continues in the Steel City.
Pickens and Austin have also been above average in these terms, while all three land below average in broken/missed tackles. Williams, in particular, has none on his 12 catches through nine games. So, I wouldn’t expect to see too much of that. That’s okay, in my opinion, considering all the churning YAC monsters Pittsburgh already has on the roster.
To close, let’s look at a more comprehensive view using points earned per route (the total of a player’s EPA responsibility on targets using the Total Points system that distributes credit among all players on the field for a given play).
Totals are scaled up to map the average points scored or allowed on a team level, with the player’s snap count determining how much to adjust. For receivers, this includes accounting for offensive line play, off-target passes dropped passes, and broken tackles) and positive rates (rate of passes thrown to the player that resulted in a positive EPA:
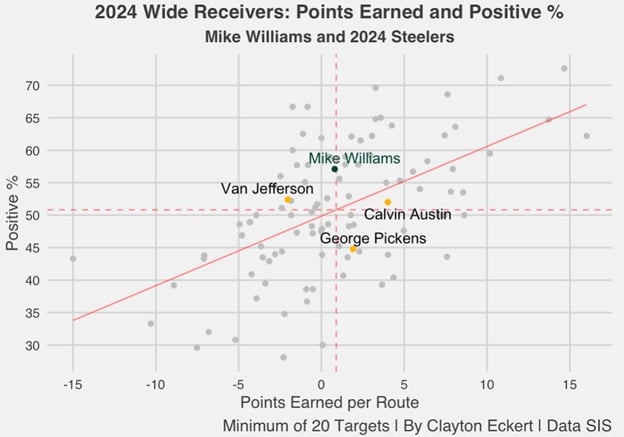

Mike Williams leads all focused players with a 57.1 positive rate, tying for 29th in the NFL. So, while things weren’t ideal in New York, he provided above-the-line value overall compared to his peers at the WR position. Considering that the rate uses EPA, which factors in the impact of scoring on a play-by-play basis, this is great to see.
In terms of points earned per route, Williams had an average of 0.8, ranking 47th. The hope is that coming to a more fluid offense currently will bode well for Williams, positively impacting his numbers and play for the rest of the 2024 season.
Overall, the move was a no-brainer considering the compensation, and I feel that his addition will bode well for Pittsburgh’s offense. Here’s to hoping that’s the case.
Here is a wrap-up rankings table of the data:
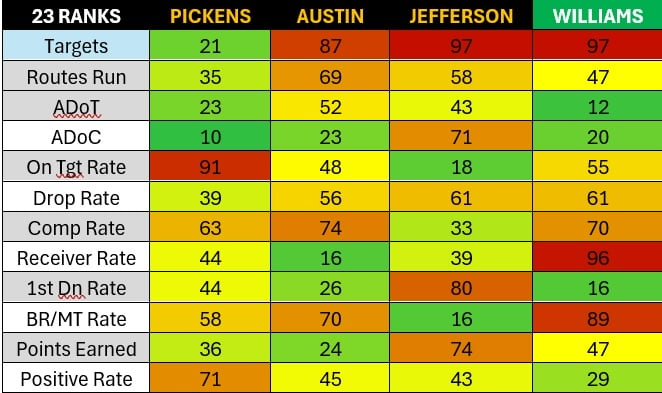

Best ranks: ADoT (12th), 1st Dn Rate (16th), ADoC (20th), Positive Rate (29th).
Middling ranks: Routes Run (47th), Points Earned (47th), On Target Rate (55th), Drop Rate (61st).
Worst ranks: Completion Rate (70th), BR/MT Rate (89th), Receiver Rate (96th), Targets (97).


